IV · THE GAME · MAJOR LEAGUE BASEBALL
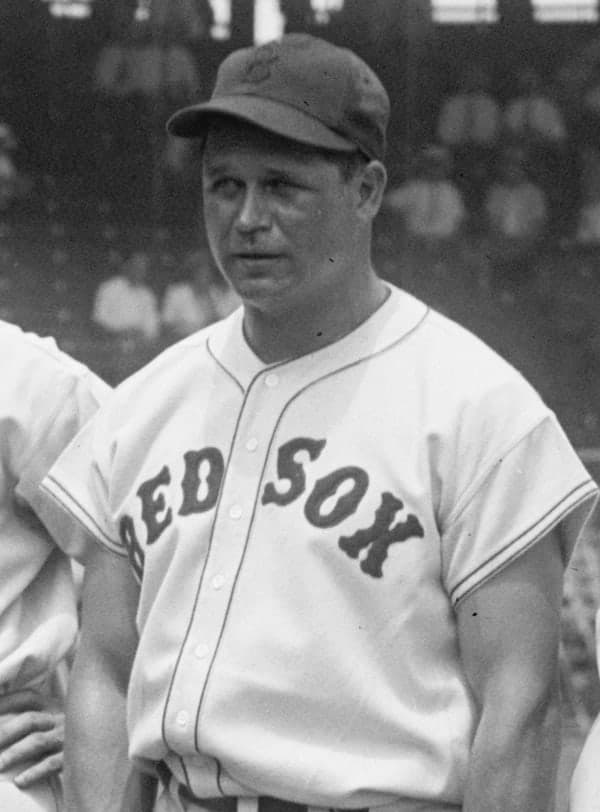
Jimmie Foxx
A career that began before he turned eighteen and ended after twenty seasons leaves a season-by-season record of when the power arrived, when it peaked, and when it finally fell away.
At a glance
- Career
- 2,317 games · 2,646 hits · 534 home runs · 1,922 runs batted in · .325 average
- Debut
- 1 May 1925, aged 17, at Griffith Stadium, Washington
- Last game
- 23 September 1945, for the Philadelphia Phillies
- Seasons played
- 20 seasons across 21 years
Look closer
The debut was nine at-bats across ten games
In 1925 Foxx appeared in ten games but came to the plate only nine times. He made six hits — a .667 average — and one of those six was a double. He walked once, struck out once, and did not drive in a run. The line describes a teenager getting occasional plate appearances rather than regular starts, and the sample is too small to mean much beyond the fact that he was there at all.
The peak years are 1932, 1933 and 1938
In 1932 Foxx hit 58 home runs and drove in 169. In 1933 he hit 48 and drove in 163. In 1938, now with Boston, he hit 50 and drove in 175. Those three seasons also show the highest slugging percentages of the career: .749, .703 and .704. The rest of the table shows power, but those three years show something more concentrated.
The 1942 season is split across two clubs
In 1942 Foxx played thirty games for Boston and seventy for Chicago. The table shows both lines separately and then a combined total for the year: 100 games, 305 at-bats, eight home runs, a .226 average. The combined line is worse than either half alone, which is what happens when you add two small samples together — the Chicago stretch, in particular, shows a .205 average across 205 at-bats, the lowest mark of any season in which he played more than twenty games.
The story
On 1 May 1925 the Philadelphia Athletics travelled to Griffith Stadium in Washington and lost 9–4. The Senators made eleven hits to Philadelphia's nine, and committed three errors to Philadelphia's none, but the game turned in the fifth inning when Washington scored five runs. Philadelphia had led 3–2 after four innings; by the end of the fifth they were down 7–3, and the margin held.
Jimmie Foxx was seventeen years old and played in that game. The season table shows he appeared in ten games that year and came to the plate nine times, making six hits. The debut game linescore does not record individual performances, so there is no way to know from these figures whether any of those six hits came on 1 May or in one of the other nine games. What the 1925 line does show is that he was in the major leagues before he turned eighteen, and that he stayed.
The table shows twenty seasons across twenty-one years. The gap is visible in the table: no line appears between 1942 and 1944, which means he did not play in the year between. The first four seasons — 1925 through 1928 — show limited games played: 10, 26, 61, 118. In 1929 the number jumps to 149, and from that year until 1941 he played between 124 and 155 games every season except one. The exception is 1942, when he played thirty games for Boston and seventy for Chicago, a combined total of 100.
The home run totals begin at zero in 1925 and 1926, then rise: 3 in 1927, 13 in 1928, 33 in 1929. They stay between 30 and 50 for most of the next decade, with two seasons above fifty: 58 in 1932 and 50 in 1938. After 1940 the totals drop sharply. In 1941 he hit 19, in 1942 he hit 8 across two clubs, and in the final two seasons — 1944 and 1945 — he hit none and seven respectively.
The batting average holds above .300 in fourteen of the twenty seasons. It falls below .300 in 1931, 1937, 1940, 1941 and 1942, and in the final two seasons it is .050 and .268. The slugging percentage — total bases divided by at-bats, a measure of power — peaks in 1932 at .749, stays above .600 in eight seasons, and falls below .500 only in the final three years.
The career totals are 2,317 games, 2,646 hits, 534 home runs, 1,922 runs batted in, and a .325 average. Those are the sums of the twenty lines in the table. The last game was on 23 September 1945, when Foxx was thirty-seven years old. The debut was on 1 May 1925, when he was seventeen.
Why it mattered then
A seventeen-year-old playing in the major leagues in 1925 was unusual but not unknown. What mattered was whether he stayed, and Foxx did. By 1929, when he was twenty-one, he was playing nearly every game and hitting thirty-three home runs. By 1932 he hit fifty-eight, which was more than he hit in any other season. The season table shows he hit 33 and 37 home runs in 1929 and 1930, drove in 118 and 156 runs, and batted .354 and .335. Those are not the highest totals of his career, but they came early — he was twenty-one and twenty-two — and they established the pattern that would hold for the next decade. In 1936 he moved to Boston, and the power totals stayed high. He hit 41 home runs that year, 36 the next, then 50 in 1938. The 1938 season shows 175 runs batted in, the highest total in the table. That same year his batting average was .349 and his slugging percentage .704, both among the highest marks of his career. The decline began in 1941, when he was thirty-three. He played 135 games that year and hit 19 home runs, less than half the total of any season since 1927. In 1942 he played for two clubs and hit eight. The table shows he returned in 1944 and 1945, but by then he was thirty-six and thirty-seven, and the numbers — fifteen games in 1944, eighty-nine in 1945 — suggest a player finishing rather than competing.
Why it matters now
The career lasted twenty seasons, which is long enough to see the shape of a playing life: the early years when the games are few, the middle stretch when the power is high and consistent, and the final seasons when the totals fall away. The table makes that shape visible without commentary. The debut at seventeen and the last game at thirty-seven frame a career that began in 1925 and ended in 1945, spanning two decades. The gap between 1942 and 1944 — the missing line in the table — sits in the middle of those years, though the figures alone do not explain why he did not play. The 534 home runs are a total that took twenty years to accumulate, and the season-by-season breakdown shows how it was done: not in one or two extraordinary years, but in a long series of seasons with totals between 30 and 50, bookended by smaller numbers at the start and the end. The highest single-season total is 58, which happened once, in 1932. The next-highest is 50, in 1938. The rest are lower. What the table preserves is the arithmetic of longevity. A player who hits thirty home runs a season for fifteen years will finish with more than a player who hits sixty once and then twenty for the next decade. Foxx did both: he hit high totals in his peak years and he played long enough for those years to add up. The record is the sum of those two things, and the table is the evidence.
The surprising detail
The career began at seventeen and ended at thirty-seven, but it was not continuous. The table shows twenty seasons across twenty-one years, which means one year is missing. No line appears between 1942 and 1944, so he did not play in the year between. The gap sits between the 1942 season, when he played for two clubs and hit eight home runs, and the 1944 season, when he played fifteen games and hit none. Why he did not play is not recorded in these figures, but the absence is visible in the table itself.
What is disputed
Every figure here comes from the MLB Stats API. Statistical categories were not all recorded consistently across the twenty seasons covered, and records for the 1920s and 1930s were compiled retrospectively from contemporary scoring; the totals are the ones the league publishes today rather than anything independently recomputed here. The 1942 season shows lines for two clubs and a combined total; the API supplies all three, and they are reproduced here as given.
Remember this
534 home runs across twenty seasons, with the highest single-season total at 58: a career built on consistency and length, not on one or two enormous years.
Test yourself
In 1942 Foxx played for two clubs. His combined batting average that year was .226, but his average with Boston alone was .270 and with Chicago alone .205. Why is the combined average lower than the Boston figure, even though the Boston stretch shows the better hitting?
Because the combined average is not the average of the two averages — it is the total hits divided by the total at-bats. Foxx had 100 at-bats with Boston and 205 with Chicago, so the Chicago stretch, despite the lower average, accounts for more than twice as many plate appearances. When you combine them, the larger Chicago sample pulls the overall average down closer to .205 than to .270. Averaging percentages only works if the sample sizes are equal, and here they are not.
Go deeper
- Jimmie Foxx — MLB Stats API player record · MLB Advanced Media
- Jimmie Foxx — career hitting totals (MLB Stats API) · MLB Advanced Media
- Debut game linescore — MLB Stats API game 99513 · MLB Advanced Media
- Jimmie Foxx — Wikidata · Wikidata
Image: Harris & Ewing, Public domain. Licence: Public domain. Source.