IV · THE GAME · MAJOR LEAGUE BASEBALL
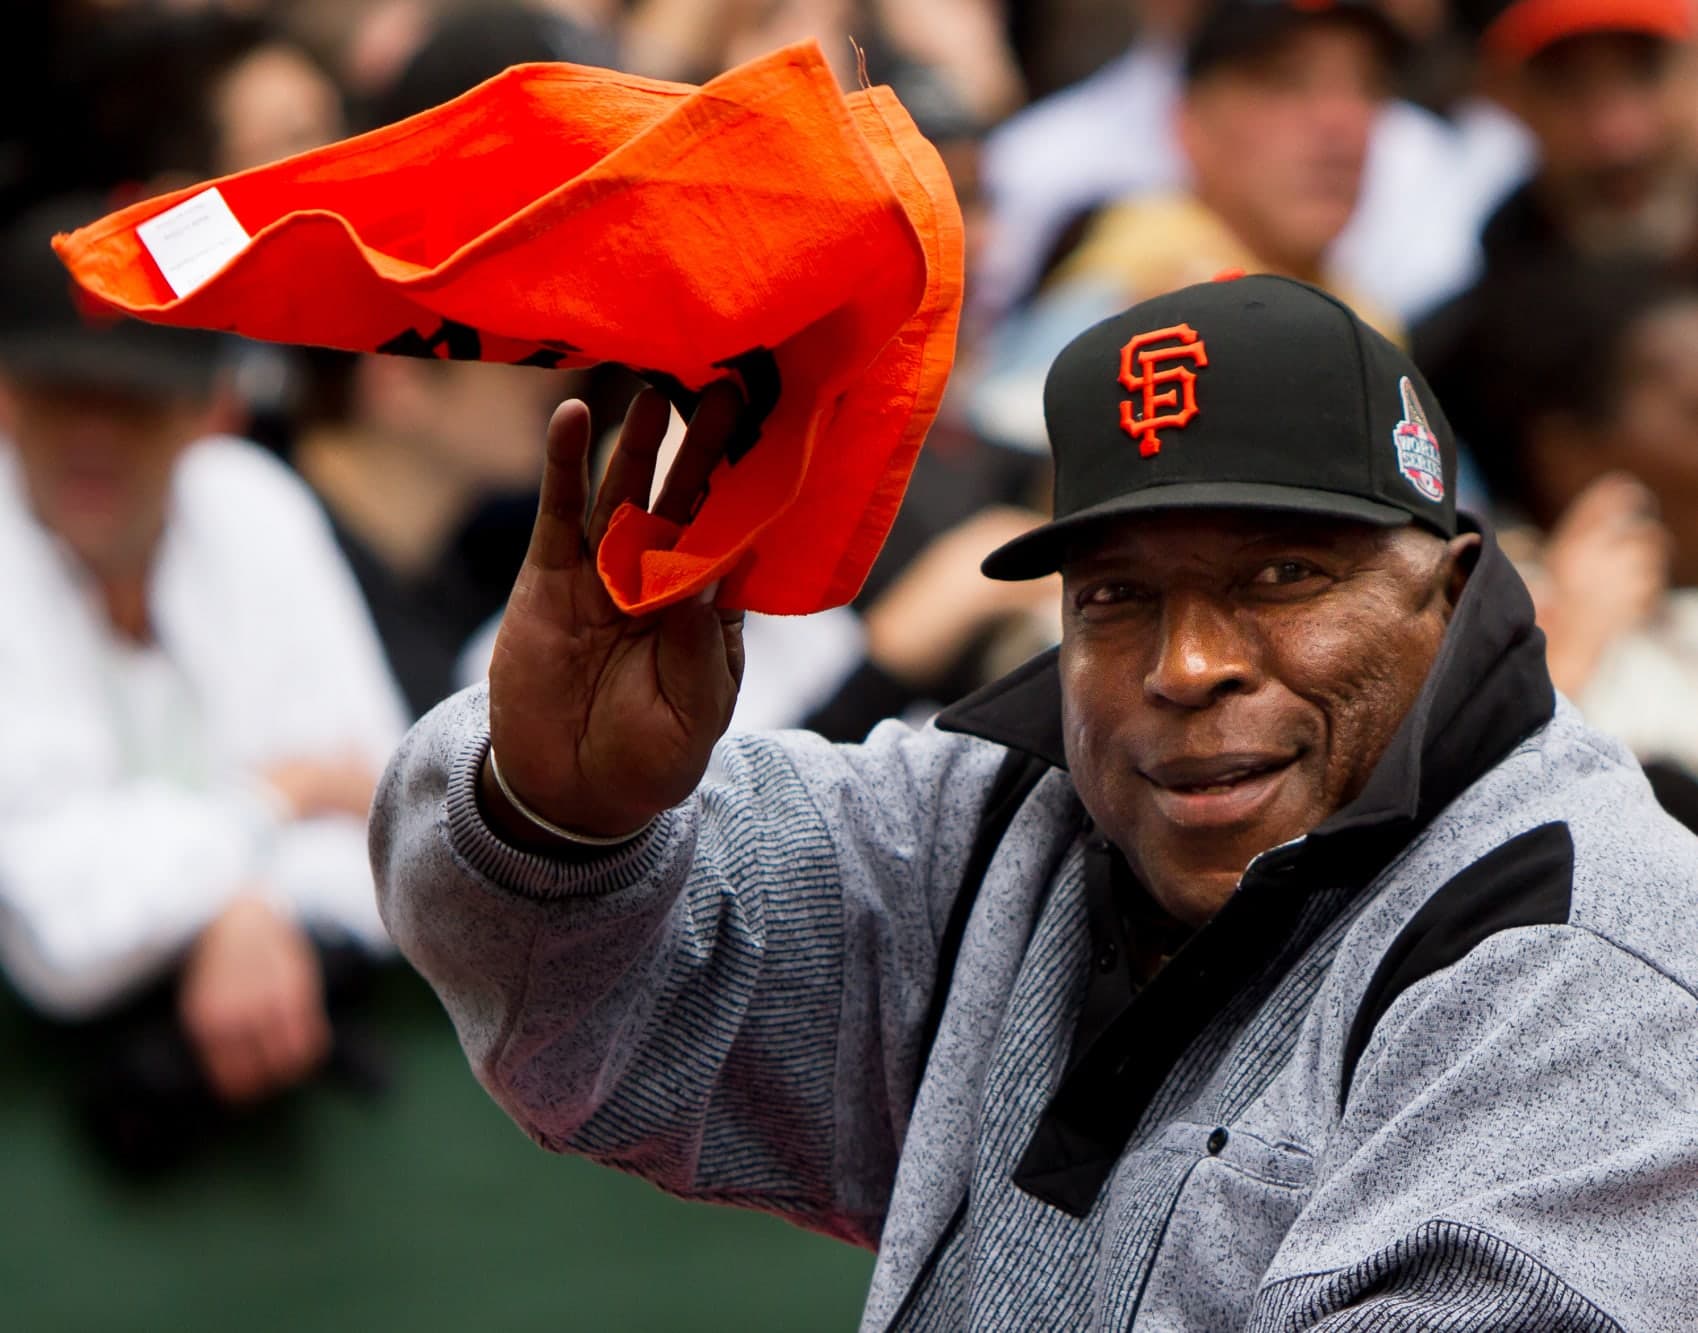
Willie McCovey
A debut season of fifty-two games and a .354 average is not a reliable guide to what comes next. The twenty-one seasons that followed show what did.
At a glance
- Career
- 2,588 games · 2,211 hits · 521 home runs · 1,555 runs batted in · .270 average
- Debut
- 30 July 1959, aged 21, at Seals Stadium, San Francisco
- Last game
- 6 July 1980, for the San Francisco Giants
- Height
- 6' 4", 210 lb · batted left, threw left
Look closer
The debut was a rout, and San Francisco never trailed
On 30 July 1959 the Giants scored in five different innings and the Phillies in one. Philadelphia made four errors to San Francisco's none, which is the width of the final margin and then one more. The Giants led 1–0 after three, 2–0 after four, 5–2 after five, and 7–2 after seven. Philadelphia never batted in the ninth, which is why that half-inning shows a dash rather than a nought. The whole thing took two hours and ten minutes in front of 10,114 people.
The debut season was fifty-two games, not a full year
McCovey's first season began on 30 July and ended when the schedule did. He played fifty-two games, made 192 at-bats, and hit .354 with thirteen home runs. The next year he played 101 games and hit .238. The third year he played 106 and hit .271. The debut season was the shortest, and the twenty-one that followed show the range the career actually covered.
The highest averages and the highest home run totals do not align
The two seasons with an average above .320 were 1959, when he hit thirteen home runs in fifty-two games, and 1969, when he hit forty-five in 149 games. The two seasons with forty or more home runs were 1969, with forty-five, and 1963, with forty-four — that second year he hit .280. The year he drove in 126 runs, which appears twice in the table, 1969 and 1970, he hit .320 and .289 respectively. A high batting average and a high home run total can appear in the same season, but they do not have to, and often they do not.
The story
On 30 July 1959 the San Francisco Giants beat the Philadelphia Phillies 7–2 at Seals Stadium. The Giants made ten hits and no errors. The Phillies made seven hits and four errors, which is two more errors than runs. San Francisco scored in the third, the fourth, the fifth twice more, and the seventh twice more. Philadelphia scored both their runs in the fifth. The game took two hours and ten minutes.
McCovey's first season was fifty-two games long, because it began in late July rather than in April. In those fifty-two games he made 192 at-bats and sixty-eight hits, which is a .354 average. He hit thirteen home runs, drove in thirty-eight, and struck out thirty-five times. The next season he played 101 games and hit .238 with thirteen home runs again. The third season he played 106 games and hit .271 with eighteen home runs. The debut season was the shortest, and those that followed show the range the career actually covered.
What followed was twenty-one more seasons, nineteen of them with San Francisco, two with San Diego, and eleven at-bats with Oakland in 1976. The home run totals rise through the early 1960s: eighteen in 1961, twenty in 1962, forty-four in 1963. They stay in the thirties and forties through the rest of the decade. The 1969 total is forty-five. That year he also drove in 126 runs, walked 121 times, and hit .320. The next year he hit thirty-nine home runs, drove in 126 again, walked 137 times, and hit .289. Those two seasons, 1969 and 1970, show on-base percentages of .453 and .444.
The totals fall in the early 1970s. In 1971 he played 105 games. In 1972 he played eighty-one. In 1973 he played 130 and hit twenty-nine home runs, but the at-bats that year were 383, which is fewer than in any full season since 1962. In 1974 he moved to San Diego and played 128 games. In 1975 he played 122. In 1976 he played seventy-one for San Diego, eleven for Oakland, and eighty-two in total. In 1977 he returned to San Francisco and played 141 games, hit twenty-eight home runs, and drove in eighty-six. The last three seasons show 108 games, 117 games, and forty-eight games. The last season was 1980, and the last game was 6 July. He was forty-two years old.
The career total is 2,588 games, 8,197 at-bats, 2,211 hits, 521 home runs, 1,555 runs batted in, and a .270 average. The 1969 home run total is forty-five. The career lasted twenty-two seasons.
Why it mattered then
A left-handed first baseman who stood six feet four inches was not the standard build in 1959, and neither was the power that came with it. The nickname the fact sheet records is Stretch, which describes the reach rather than the height but depends on both. The debut season lasted fifty-two games and produced thirteen home runs, which is one every four games, and a .354 average. The season began in late July, not in April, and ended when the schedule did. The next year he hit .238 in twice as many games. The gap between those two figures is wide, and it is the gap a career has to cross — the debut season is not a promise, it is an opening, and the question is what gets built after it.
Why it matters now
The career total is 521 home runs, which is a number that used to mean something specific and now means something different. It used to sit in a short list, and now it sits in a longer one. The thing that has not changed is the arithmetic: 521 home runs across twenty-two seasons is an average of twenty-three or twenty-four a year, which is not forty-five every year, it is twenty-odd every year for two decades. The 1969 total is forty-five, and it appears once. The rest of the column shows thirties, twenties, high teens, and single digits. A career total is not a peak, it is a sum, and the sum here is made of length rather than height. The debut season is fifty-two games and a .354 average. The last season is forty-eight games and a .204 average. The career is everything in between, and the thing in between is time.
The surprising detail
The two figures that sit oddest together are .354 and .238 — the first season's average and the second season's average. The first season was fifty-two games long, the second was 101 games long, and the gap between the two numbers is 116 points, which is the width of the difference between a debut that looks like a guarantee and a second season that looks like a correction. The next-highest average in the table is .320, in 1969, which is thirty-four points lower than the debut figure. The debut season was the shortest in the table, and the career that followed was built out of the seasons that looked more like the second year than the first.
What is disputed
Every figure here comes from the MLB Stats API. Statistical categories were not all recorded consistently across the twenty-two seasons covered, and records for the 1950s were compiled retrospectively from contemporary scoring; the totals are the ones the league publishes today rather than anything independently recomputed here.
Remember this
521 home runs, and the debut season — fifty-two games, .354 — followed by a second season of .238.
Test yourself
The season table shows two years in which McCovey drove in 126 runs. In one of those years he hit forty-five home runs, in the other he hit thirty-nine. What else in the table explains how the same RBI total came from two different home run totals?
Walks and average. In 1969 he walked 121 times and hit .320. In 1970 he walked 137 times and hit .289. A walk puts the batter on first base, which means it puts a runner on base for the next batter to drive in. The 1970 season shows sixteen fewer home runs than 1969 but sixteen more walks, and the RBI total is identical. The difference is that more of the runs in 1970 were driven in by hits that were not home runs — and more of the opportunities to drive them in came from walks rather than from hits. Note too that the 1970 on-base percentage is .444, which is nine points lower than 1969's .453, even though the walk total is higher: that is because the batting average is thirty-one points lower, and on-base percentage is a combination of hits and walks. The two seasons show that the same offensive output can come from different combinations of power, contact, and patience.
Go deeper
- Willie McCovey — MLB Stats API player record · MLB Advanced Media
- Willie McCovey — career hitting totals (MLB Stats API) · MLB Advanced Media
- Debut game linescore — MLB Stats API game 142190 · MLB Advanced Media
- Willie McCovey — Wikidata · Wikidata
Image: Holly Hickman. Licence: CC BY-SA 2.0. Source.