IV · THE GAME · MAJOR LEAGUE BASEBALL
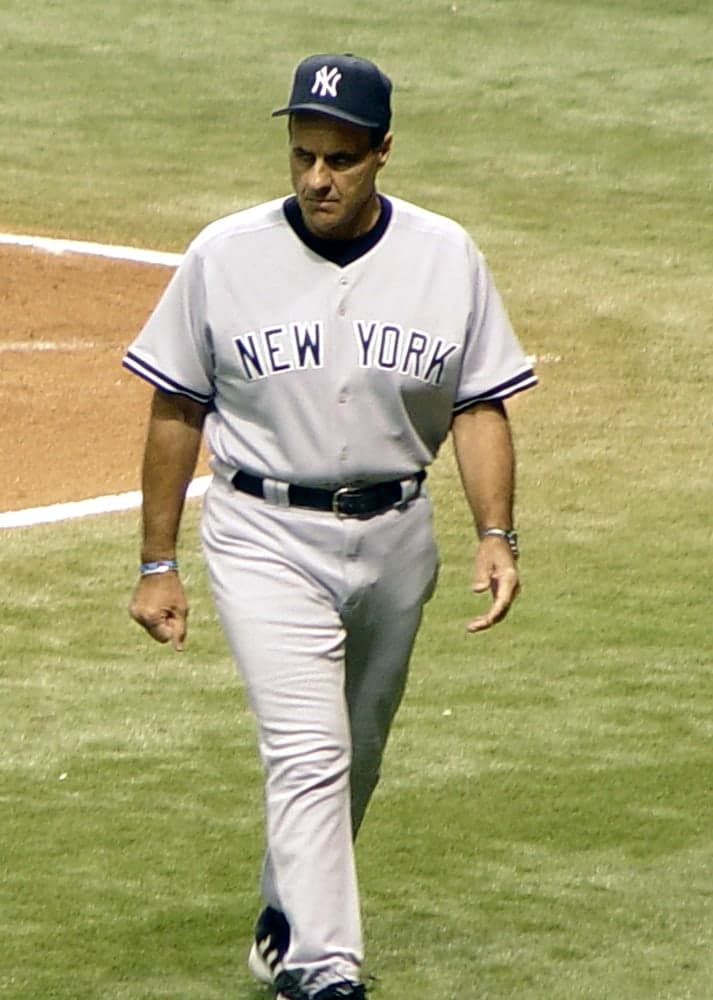
Joe Torre
A career built season by season rather than year by year is harder to summarise than one enormous stretch. Torre's highest total was 230 hits. The rest is arithmetic and time.
At a glance
- Career
- 2,209 games · 2,342 hits · 252 home runs · 1,185 runs batted in · .297 average
- Debut
- 25 September 1960, aged 20, at Milwaukee County Stadium
- Last game
- 17 June 1977, for the New York Mets
- Build
- 6' 2" · 212 lb · batted right · threw right
Look closer
The debut was a walk-off win in ten innings
On 25 September 1960 the Milwaukee Braves and the Pittsburgh Pirates were scoreless through four innings. Pittsburgh scored once in the fifth and once in the seventh; Milwaukee scored twice in the eighth to level it at 2–2, then twice more in the tenth to win 4–2. Pittsburgh made six hits to Milwaukee's seven, but committed two errors to Milwaukee's none. The whole thing took two hours and fourteen minutes in front of 38,109 people. The home side never batted in the ninth, which is why that half-inning is a dash rather than a nought.
1971 stands alone in the table
In 1971 Torre made 230 hits in 634 at-bats, for an average of .363. No other season is within forty hits of that total, and no other average is within forty points. He drove in 137 runs — sixteen more than the next-highest season — and his on-base plus slugging that year was .976, nearly eighty points above any other line in the table. The figures before and after are consistent with one another; 1971 is the outlier.
The last three seasons show the end arriving
In 1975 Torre played 114 games and hit .247. In 1976 he played 114 games again and hit .306. In 1977 he played 26 games, made nine hits in fifty-one at-bats, and recorded a .176 average. The number of games falls by more than three-quarters, and the average falls with it. The last line is not a full season; it is the final twenty-six games of an eighteen-year career, played at age thirty-six.
The story
On 25 September 1960 the Milwaukee Braves played the Pittsburgh Pirates at Milwaukee County Stadium. The game was scoreless through four innings. Pittsburgh scored once in the fifth and once in the seventh to lead 2–0. Milwaukee scored twice in the eighth to level it, and the game went to extra innings. In the tenth Milwaukee scored twice more and won 4–2. Pittsburgh made six hits to Milwaukee's seven, and committed two errors to Milwaukee's none. The game took two hours and fourteen minutes in front of 38,109 people. Joe Torre, aged twenty, caught that game. He had two at-bats, made one hit, and struck out once.
That was the whole of his 1960 season: two games, two at-bats, one hit. The following year he played 113 games for the Braves, made 113 hits in 406 at-bats, and hit .278. In 1962 he played eighty games and hit .282. In 1963 he played 142 games, made 147 hits, and hit .293. In 1964 he played 154 games, made 193 hits, and hit .321 — his first season above .300.
The Braves moved from Milwaukee to Atlanta in 1966. Torre played 148 games that year, made 172 hits, hit thirty-six home runs, and drove in 101 runs. His average was .315 and his on-base plus slugging — a measure that adds the rate at which a batter reaches base to the rate at which he advances bases — was .942, the highest in his career to that point.
In 1969 he moved to the St. Louis Cardinals. He played 159 games, made 174 hits, and hit .289. In 1970 he played 161 games, made 203 hits, and hit .325. In 1971 he played 161 games, made 230 hits, drove in 137 runs, and hit .363. His on-base plus slugging that year was .976. No other season in the table is within forty hits or forty points of average of that total. The figures before and after are consistent with one another; 1971 is the outlier.
From 1972 to 1974 he played between 141 and 149 games each season, hit between .282 and .289, and drove in between sixty-nine and eighty-one runs. In 1975 he moved to the New York Mets. He played 114 games and hit .247. In 1976 he played 114 games again and hit .306. In 1977 he played twenty-six games, made nine hits in fifty-one at-bats, and hit .176. His last game was on 17 June 1977.
Across eighteen seasons he played 2,209 games, made 2,342 hits, hit 252 home runs, drove in 1,185 runs, and finished with a .297 average. The career lasted from 1960 to 1977 — eighteen years from debut to last game, and eighteen distinct seasons in the table.
Why it mattered then
A catcher who could hit was valuable in the 1960s and 1970s because the position demanded defensive work that left less energy for offence. Catchers spent every inning crouched behind the plate, signalling pitches, blocking balls in the dirt, and throwing out runners attempting to steal. The physical toll was high, and most catchers were kept in the lineup for their defence rather than their batting. Torre's numbers show a player who could do both. In 1964 he hit .321 with twenty home runs and 109 runs batted in. In 1966 he hit thirty-six home runs and drove in 101. In 1971 he made 230 hits and drove in 137 runs, and his .363 average was the highest in the table by forty points. Those totals came from a catcher, which meant the club did not have to choose between offence and defence at that position. The eighteen-season span also mattered. A player who could produce at that level for that long gave a club stability at a difficult position. Torre played more than 140 games in seven different seasons, which meant he was in the lineup nearly every day in those years. The consistency is visible in the table: between 1963 and 1974, twelve consecutive seasons, he played at least 113 games every year, and in ten of those twelve he played at least 135.
Why it matters now
The career is a record of how long a player could sustain performance at a high level, and how that performance changed over time. The table shows the rise clearly: from two games in 1960 to 154 games in 1964, from a .278 average in 1961 to .321 in 1964 and .363 in 1971. It also shows the decline: from .306 in 1976 to .176 in twenty-six games in 1977, the final line in the table. The shape of the career — eighteen seasons, three clubs, 2,209 games — is a reminder that longevity is a skill. Torre played more than a hundred games in fifteen of his eighteen seasons. He played more than 140 games in seven of them. The ability to stay in the lineup, season after season, across nearly two decades, is as much a part of the record as the 2,342 hits or the .297 average. The 1971 season stands out in the table because it is so far above the others. But the rest of the career is not negligible: it is a long stretch of consistent production, year after year, across three different clubs. The record is the sum of all those seasons, not just the one exceptional year.
The surprising detail
The two totals that sit oddest together are 2,342 hits and 230 — the most he made in one season. That season, 1971, is forty hits ahead of the next-highest total and stands alone in the table. But the career total was not built on seasons like that one. It was built on seasons like 1970 (203 hits), 1964 (193 hits), and 1966 (172 hits) — and on the fact that he played more than a hundred games in fifteen of eighteen seasons. The record is a length of time as much as it is a talent.
What is disputed
Every figure here comes from the MLB Stats API. Statistical categories were not all recorded consistently across the eighteen seasons covered, and some records for the early 1960s were compiled retrospectively from contemporary scoring; the totals are the ones the league publishes today rather than anything independently recomputed here.
Remember this
2,342 hits across eighteen seasons, and never more than 230 in a year: the total is a span of time as much as a set of numbers.
Test yourself
Milwaukee and Pittsburgh each made fewer than ten hits in Torre's debut game, and Milwaukee won by two runs in extra innings. Using only the linescore, what explains the result?
Errors and timing. Pittsburgh made two errors to Milwaukee's none, and a two-run margin is exactly the size of that gap. The runs also arrived in different shapes: Pittsburgh scored once in the fifth and once in the seventh, while Milwaukee put two on the board in the eighth to level it at 2–2, then two more in the tenth to win 4–2. Equal hit totals do not mean equal innings — clustered hits score, scattered ones strand runners. Note too that Milwaukee never batted in the ninth, which is why that half-inning shows a dash: the home side does not bat when the game is tied or when it is already ahead.
Go deeper
- Joe Torre — MLB Stats API player record · MLB Advanced Media
- Joe Torre — career hitting totals (MLB Stats API) · MLB Advanced Media
- Debut game linescore — MLB Stats API game 143816 · MLB Advanced Media
- Joe Torre — Wikidata · Wikidata
Image: CC BY-SA 3.0. Licence: CC BY-SA 3.0. Source.