IV · THE GAME · MAJOR LEAGUE BASEBALL
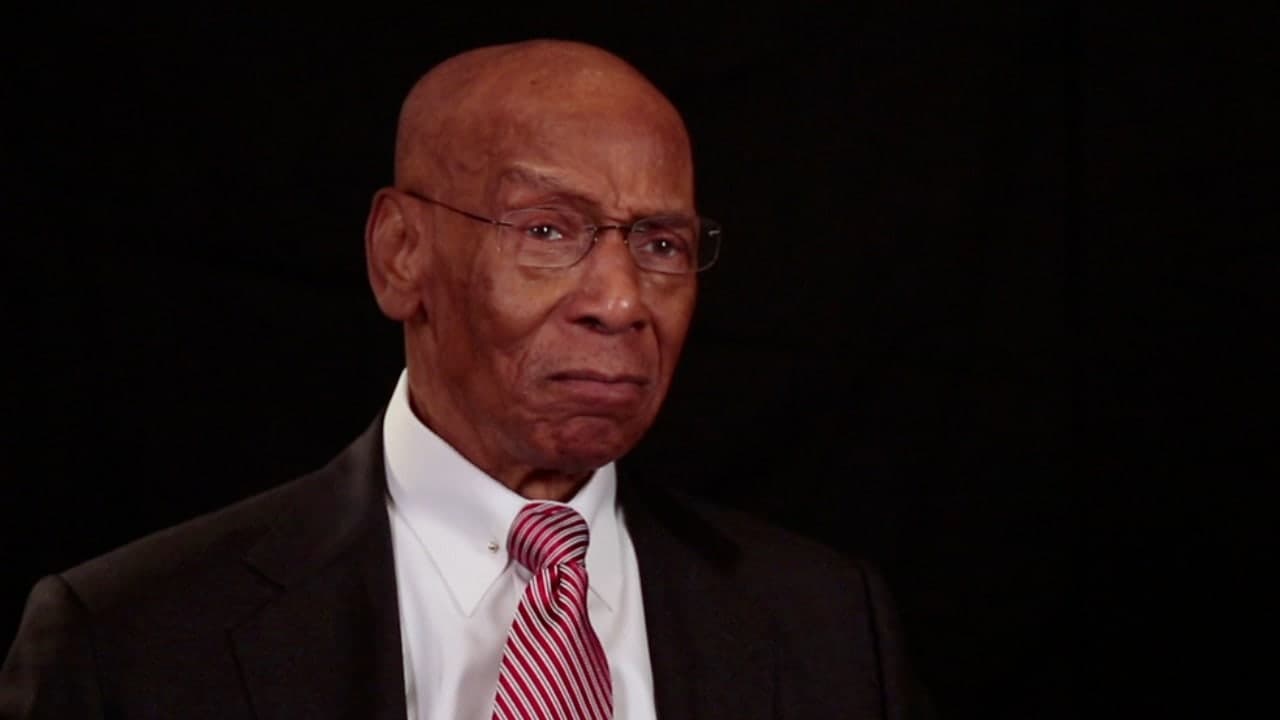
Ernie Banks
A career spent entirely with one club is rare enough that the nickname stuck: Mr. Cub. The numbers show what nineteen seasons in the same lineup look like, year by year.
At a glance
- Career
- 2,528 games · 2,583 hits · 512 home runs · 1,636 runs batted in · .274 average
- Debut
- 17 September 1953, aged 22, at Wrigley Field
- Last game
- 26 September 1971, for the Chicago Cubs
- Seasons played
- 19 seasons, all with Chicago
Look closer
The debut was a rout, and the errors tell part of the story
On 17 September 1953 the Philadelphia Phillies made eighteen hits and the Chicago Cubs made ten. Philadelphia won 16–4. The Cubs committed three errors to Philadelphia's none, and the runs arrived in clusters: Philadelphia scored four in the third, four in the fourth, and five in the eighth. Chicago's three runs in the fifth were their only multi-run inning. The attendance was 2,793 — a small crowd even for a Thursday afternoon in September.
The peak years were 1955 through 1960
The home-run totals in those six seasons were 44, 28, 43, 47, 45, and 41. The runs-batted-in totals were 117, 85, 102, 129, 143, and 117. The batting averages ranged from .271 to .313. After 1960 the home-run totals never reached forty again, and the batting average dropped below .280 in all but two of the remaining eleven seasons. The shape is a plateau rather than a single spike: six strong years, then a long descent.
The stolen-base total stayed low throughout
Across 2,528 games he stole fifty bases. The highest single-season total was nine, in 1955. In seven of the nineteen seasons he stole one base or none. The profile is that of a power hitter who stayed in the middle of the order: runs batted in and home runs were the contributions, not speed.
The story
On 17 September 1953 the Chicago Cubs played the Philadelphia Phillies at Wrigley Field in front of 2,793 people. Philadelphia made eighteen hits to Chicago's ten and won 16–4. The Cubs committed three errors to Philadelphia's none. Philadelphia scored four runs in the third inning, four more in the fourth, and five in the eighth. Chicago scored three in the fifth and one in the ninth. The whole thing took two hours and forty-one minutes.
That was the debut. The career that followed lasted nineteen seasons, all of them with the Cubs. The season-by-season table shows a shape: a short climb, a plateau, and a long descent. In 1953 he played ten games and hit .314 with two home runs. In 1954, his first full season, he played all 154 games and hit nineteen home runs with a .275 average. In 1955 the home-run total jumped to forty-four and the average to .295. The runs batted in that year were 117.
The strongest stretch was 1955 through 1960. The home-run totals in those six years were 44, 28, 43, 47, 45, and 41. The runs-batted-in totals were 117, 85, 102, 129, 143, and 117. The batting averages ranged from .271 to .313. The highest single-season home-run total — forty-seven — came in 1958, when he also drove in 129 runs and hit .313. The highest runs-batted-in total — 143 — came in 1959, when he hit forty-five home runs and .304.
After 1960 the numbers fell. The home-run totals never reached forty again. The highest in the remaining eleven seasons was thirty-seven, in 1962. The batting average dropped below .280 in all but two of those seasons. In 1963 it was .227, the lowest of the career. In 1970 he played seventy-two games, and in 1971 he played thirty-nine, hitting .193 in what would be his final season.
The stolen-base total stayed low throughout. Across 2,528 games he stole fifty bases. The highest single-season total was nine, in 1955. In seven of the nineteen seasons he stole one base or none. The profile is that of a power hitter who stayed in the middle of the order: runs batted in and home runs were the contributions, not speed.
The career total of 512 home runs was accumulated twenty-odd or thirty-odd at a time across nineteen years. The total of 2,583 hits came at a rate of around 130 to 180 per season during the peak years, then fewer as the playing time decreased. The last game was on 26 September 1971.
Why it mattered then
A career spent entirely with one club was already unusual by the 1950s, though not yet rare. The Cubs were not a winning side during most of these nineteen seasons — they finished above .500 in only six of them — so the totals were accumulated without the leverage of October baseball or the attention that comes with pennant races. The home-run totals in the late 1950s were large enough to draw notice in any season, and the runs-batted-in totals in 1958 and 1959 — 129 and 143 — were substantial figures by any measure. But the context was a club that finished fifth or sixth or seventh, so the individual numbers stood alone rather than as part of a team story. The nickname Mr. Cub was not ironic, but it did describe a relationship with a single institution rather than with the sport as a whole.
Why it matters now
The career is a shape that no longer appears: nineteen seasons, one uniform, and a long decline played out in public rather than ended early. The peak years were six seasons long, which is a different profile from the three or four explosive years that define most power hitters. The stolen-base total — fifty across 2,528 games — marks him as a player from an era when the running game was not yet central to offense, and the home-run and runs-batted-in totals mark him as a middle-of-the-order hitter whose job was to drive in runs, not to get on base and score them himself. The debut game, a 16–4 loss in front of 2,793 people, and the last game, in 1971 after thirty-nine games and a .193 average, frame a career that was neither compressed into a few brilliant seasons nor cut short at its height. It was played all the way through, and all of it in the same place.
The surprising detail
The highest batting average of the career — .314 — came in the debut season, 1953, when he played only ten games. The second-highest was .313, in 1958, the same year as the highest home-run total. The lowest was .193, in 1971, the final season, when he played thirty-nine games. The gap between the debut average and the final average is 121 points, which is the distance between a strong hitter and a struggling one. The career average of .274 sits almost exactly in the middle of those two figures, which is what happens when a career lasts long enough to include both extremes.
What is disputed
Every figure here comes from the MLB Stats API. Statistical categories were not all recorded consistently across the nineteen seasons covered, and records for the 1950s were compiled retrospectively from contemporary scoring; the totals are the ones the league publishes today rather than anything independently recomputed here.
Remember this
Nineteen seasons, 512 home runs, and every one of the 2,528 games in a Chicago Cubs uniform.
Test yourself
The debut game on 17 September 1953 ended 16–4 to Philadelphia. The Cubs made ten hits to Philadelphia's eighteen, and committed three errors to Philadelphia's none. Using only the linescore, what pattern explains the margin?
Philadelphia's runs arrived in three large clusters — four in the third, four in the fourth, and five in the eighth — while Chicago's four runs were spread across two innings, three in the fifth and one in the ninth. Equal hits do not mean equal innings: clustered hits score runs, scattered ones leave runners stranded. The three errors by Chicago, compared to Philadelphia's zero, also suggest that Philadelphia's big innings were helped by defensive mistakes as well as hits. A twelve-run margin is wider than three errors alone would explain, but the combination of clustered offense and defensive lapses is visible in the inning-by-inning totals.
Go deeper
- Ernie Banks — MLB Stats API player record · MLB Advanced Media
- Ernie Banks — career hitting totals (MLB Stats API) · MLB Advanced Media
- Debut game linescore — MLB Stats API game 135147 · MLB Advanced Media
- Ernie Banks — Wikidata · Wikidata
Image: White House photographer, Public domain. Licence: Public domain. Source.