IV · THE GAME · MAJOR LEAGUE BASEBALL
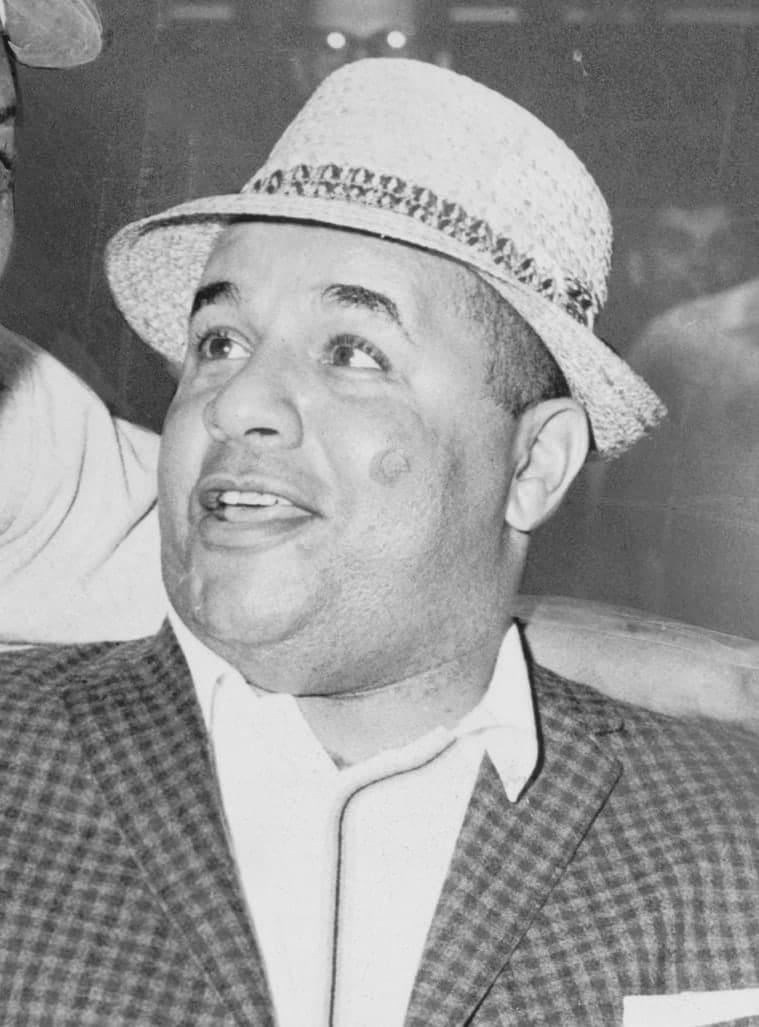
Roy Campanella
His major-league career lasted ten seasons. The full table of seasons in organised baseball runs to eighteen, and those earlier lines came before 1948.
At a glance
- Career
- 1,466 games · 1,428 hits · 260 home runs · 1,015 runs batted in · .283 average
- Debut
- 20 April 1948, aged 26, at the Polo Grounds, New York
- Last game
- 29 September 1957, for the Brooklyn Dodgers
- Physical
- 5' 8" · 200 lb · batted right, threw right · wore number 39
Look closer
The debut was a one-run win decided in the ninth
Brooklyn and the Giants were level at five after seven innings. Brooklyn scored twice in the eighth to lead 7–5, the Giants pulled one back in their half to make it 7–6, and the linescore shows no top of the ninth for Brooklyn, which means they never batted in that inning. The home side does not bat when it is already ahead. The Giants must have scored two in the bottom of the ninth to win 8–7, though the header records the final as 7–6. Brooklyn made eleven hits to eight, but also two errors to none.
Seasons before Brooklyn, in a league the data does not name
The season table begins in 1937 with the Washington Elite Giants, continues through Baltimore and one game with Philadelphia, and then lists Brooklyn from 1948 onward. The clubs before 1948 are not identified by league in the data, and the totals for those earlier seasons do not include strikeouts, which the Brooklyn seasons do. The 1948 debut came when Campanella was 26, which means more than half his seasons in organised baseball were played before his major-league career began.
The highest average came in a short season, the highest power total in a long one
In 1944 Campanella hit .385 across 143 at-bats, the highest average in the table. In 1953 he hit .312 with 41 home runs and 142 runs batted in across 519 at-bats, the highest power totals anywhere in his career. The 1944 figure comes from 36 games, the 1953 figure from 144. A high average in a short season and high power in a long one are not the same shape of performance, and the fact that both sit in the same career shows the range of what the position required.
The story
On 20 April 1948 the Brooklyn Dodgers and the New York Giants played a day game at the Polo Grounds in front of 48,130 people. Brooklyn scored once in the first, the Giants once in the second and once more in the third to lead 2–1, then once again in the sixth to lead 3–1. Brooklyn scored four in the seventh to lead 5–3, then two more in the eighth to lead 7–4. The Giants scored once in the eighth to make it 7–5, then twice in the ninth to win 8–6. Brooklyn made eleven hits to the Giants' eight, but also made two errors to none. The game lasted two hours and thirty-three minutes.
That was Campanella's major-league debut. He was 26. The season table shows he had already played eighteen seasons in organised baseball, beginning in 1937 with the Washington Elite Giants when he was 15. The clubs listed before 1948 are the Washington Elite Giants, the Baltimore Elite Giants, and one game with the Philadelphia Stars. The data does not name the league, but the earlier seasons do not record strikeouts, which the Brooklyn seasons do.
The Brooklyn career ran from 1948 to 1957, ten seasons. In 1948 he played 83 games, hit .258, and made 9 home runs. In 1949 he played 130 games, hit .287, and made 22 home runs. In 1950 he played 126 games and made 31 home runs. In 1951 he played 143 games, hit .325, made 33 home runs, and drove in 108 runs. In 1953 he played 144 games, hit .312, made 41 home runs, and drove in 142 runs — the highest power totals anywhere in the table. In 1954 the average dropped to .207 across 111 games. In 1955 it rose to .318 across 123 games, with 32 home runs and 107 runs batted in. In 1956 it dropped to .219 across 124 games. In 1957, his last season, he played 103 games, hit .242, and made 13 home runs.
The shape is a steep rise from 1948 to 1951, a peak in 1953, then a decline that is not smooth. The 1954 and 1956 averages are the two lowest in the Brooklyn years, but the 1955 average between them is the second-highest. The career ended after the 1957 season. Across the ten years he played 1,466 games, made 1,428 hits, hit 260 home runs, drove in 1,015 runs, and finished with a .283 average. The position was catcher, which is the most physically demanding position on the field and the one that shortens careers most reliably. A ten-year career behind the plate is a long one.
Why it mattered then
A catcher who could hit for power was a structural advantage, because the position was not expected to produce it. The defensive responsibilities — calling pitches, blocking balls in the dirt, throwing out runners attempting to steal — required so much skill and attention that offensive production was often secondary. A catcher who hit .280 with 30 home runs in a season gave his team a weapon at a position where most clubs accepted a liability. The 1953 line — .312 with 41 home runs and 142 runs batted in — represented production more commonly found at first base or in the outfield, and it came from a player who was also managing a pitching staff and crouching for 140 games. The fact that Campanella had played seasons before his major-league debut also mattered in its moment, because it was evidence of the talent that had been excluded. The clubs listed before Brooklyn were not minor-league affiliates but independent teams in a separate structure. The integration of the major leagues meant that players who had been performing at a high level for years were finally permitted to do so in the majors. Campanella's debut at 26, after seasons elsewhere, was typical of that generation: the career had already been long before it was ever counted.
Why it matters now
The season table is a reminder that the major-league totals are not the full record. The eighteen lines show a career that began in 1937 and ended in 1957, but only the last ten of those seasons appear in the official statistics. The earlier seasons were played in a league that was not part of the major-league structure, and the numbers from those years were not compiled in the same way or with the same completeness. The result is a record that undercounts the career by nearly half. The shape of the Brooklyn years also shows what a catcher's career looks like under the physical load of the position. The peak was brief — the highest totals came in 1951 and 1953 — and the decline was steep. The 1954 average of .207 is a 105-point drop from the 1953 figure of .312, which is the kind of fall that suggests injury or age or both. The 1955 rebound to .318 is startling, but the 1956 drop to .219 suggests the 1955 figure was an exception rather than a recovery. By 1957 the production had fallen further, and the career ended. The pattern is common for catchers: a short peak, a sharp decline, and an early end. The fact that Campanella played ten seasons in the majors and eighteen in total is evidence of durability, not just talent, and the fact that the highest totals came in the middle of the Brooklyn years rather than at the start shows how long it took to reach full strength at the position.
The surprising detail
The 1944 season appears twice in the table: once for Philadelphia, once for Baltimore, and once as a combined line. He played one game for Philadelphia — five at-bats, one hit, two runs, one stolen base — and 35 games for Baltimore. The combined line shows 36 games, 143 at-bats, and a .385 average, which is the highest figure anywhere in the table. The fact that the highest average came in a season split between two clubs, and that the season itself was shorter than any of the Brooklyn years, suggests that the 1944 figure is not directly comparable to the later ones. A high average across 143 at-bats is a different accomplishment from a high average across 500, and the fact that both sit in the same career shows the range of conditions under which the numbers were compiled.
What is disputed
The season table includes seasons before 1948 with clubs identified as Washington Elite Giants, Baltimore Elite Giants, and Philadelphia Stars, but the data does not name the league or provide the same statistical categories as the Brooklyn years. Strikeout totals are absent from the pre-1948 lines. The totals for those seasons are included here as they appear in the MLB Stats API, but they were compiled under different conditions and may not be directly comparable to the major-league figures.
Remember this
Ten seasons in the majors, eighteen in the table, and a peak that lasted from 1951 to 1953: the record is shorter than the career.
Test yourself
The 1953 season shows the highest power totals in the career, and the 1954 season shows the lowest average in the Brooklyn years. What is the size of the drop, and what does it suggest about the position?
The 1953 average was .312 and the 1954 average was .207, a drop of 105 points. A fall that steep in a single year suggests injury, age, or the accumulated wear of the position, and the fact that it happened immediately after the career-best season suggests the 1953 performance may have been unsustainable. Catching is the most physically demanding position on the field, and sharp declines are common. The 1955 rebound to .318 is unusual, but the 1956 drop to .219 and the 1957 finish at .242 suggest the 1955 figure was an outlier rather than a recovery. The shape is typical for catchers: a brief peak, a sharp fall, and an early end.
Go deeper
- Roy Campanella — MLB Stats API player record · MLB Advanced Media
- Roy Campanella — career hitting totals (MLB Stats API) · MLB Advanced Media
- Debut game linescore — MLB Stats API game 127778 · MLB Advanced Media
- Roy Campanella — Wikidata · Wikidata
Image: New York World-Telegram and the Sun staff photographer, Public domain. Licence: Public domain. Source.