IV · THE GAME · MAJOR LEAGUE BASEBALL
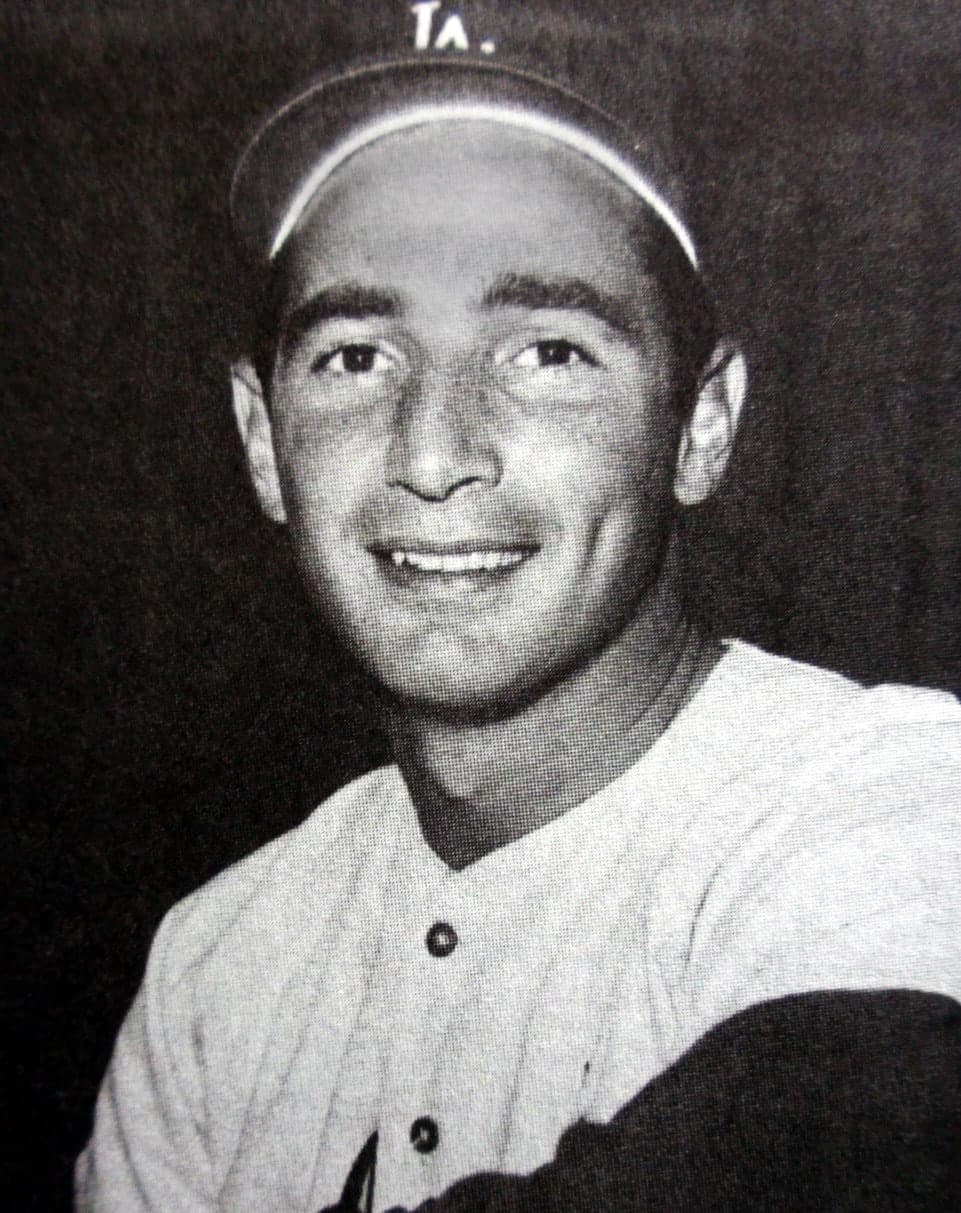
Sandy Koufax
The career lasted twelve seasons and divides cleanly in half: six years learning to throw strikes, and six years throwing them better than almost anyone.
At a glance
- Career
- 397 games · 165 wins · 87 losses · 2,396 strikeouts · 2.76 ERA
- Debut
- 24 June 1955, aged 19, at Milwaukee County Stadium
- Last game
- 2 October 1966, for the Los Angeles Dodgers
- Build
- 6' 2" · 210 lb · threw left, batted right · wore number 32
Look closer
The debut was a loss in front of 43,068 people
On 24 June 1955 the Brooklyn Dodgers and the Milwaukee Braves each made eight hits, but the Braves won 8–2. Milwaukee scored three runs in the second inning and three more in the third, and Brooklyn never closed the gap. The Dodgers made two errors to Milwaukee's none, which is the width of the final margin. The game took two hours and forty-three minutes. Milwaukee never batted in the ninth, which is why that half-inning shows a dash rather than a zero: the home side does not bat when it is already ahead.
The first five seasons are a study in wildness
In 1955 he walked twenty-eight batters in forty-one and two-thirds innings and struck out thirty — almost one walk for every strikeout. In 1956 he walked twenty-nine in fifty-eight and two-thirds innings. In 1958 he walked one hundred and five in one hundred and fifty-eight and two-thirds innings, more than half a walk per inning. The strikeouts were rising too — one hundred and twenty-two in 1957, one hundred and thirty-one in 1958, one hundred and seventy-three in 1959 — but the walks stayed high. His earned run average in those first five seasons never fell below 3.88.
The second half of the career is a different shape entirely
In 1961 he walked ninety-six batters in two hundred and fifty-five and two-thirds innings and struck out two hundred and sixty-nine. The ratio had inverted. In 1962 he walked fifty-seven in one hundred and eighty-four and one-third innings and struck out two hundred and sixteen. His earned run average fell to 2.54. In 1963 it fell to 1.88, with three hundred and six strikeouts and fifty-eight walks in three hundred and eleven innings. In 1964 it fell to 1.74. In 1965 he struck out three hundred and eighty-two batters in three hundred and thirty-five and two-thirds innings and walked seventy-one. In 1966 his earned run average was 1.73, and he completed twenty-seven of the forty-one games he started.
The story
The debut game took place on 24 June 1955 at Milwaukee County Stadium in front of 43,068 people. Brooklyn and Milwaukee each made eight hits, but Milwaukee won 8–2. The Braves scored three runs in the second inning and three more in the third, and Brooklyn never closed the gap. The Dodgers made two errors to Milwaukee's none, which is exactly the width of the final margin. The game took two hours and forty-three minutes. Milwaukee never had to bat in the ninth, which is why that half-inning shows a dash rather than a zero: the home side does not bat when it is already ahead.
The career lasted twelve seasons and divides cleanly in half. The first six years are a study in wildness. In 1955 he walked twenty-eight batters in forty-one and two-thirds innings and struck out thirty — almost one walk for every strikeout. In 1956 he walked twenty-nine in fifty-eight and two-thirds innings. In 1958 he walked one hundred and five in one hundred and fifty-eight and two-thirds innings, more than half a walk per inning pitched. The strikeouts were rising — one hundred and twenty-two in 1957, one hundred and thirty-one in 1958, one hundred and seventy-three in 1959 — but the walks stayed high. His earned run average in those first five seasons never fell below 3.88.
In 1961 the ratio inverted. He walked ninety-six batters in two hundred and fifty-five and two-thirds innings and struck out two hundred and sixty-nine. In 1962 he walked fifty-seven in one hundred and eighty-four and one-third innings and struck out two hundred and sixteen, and his earned run average fell to 2.54. In 1963 it fell to 1.88, with three hundred and six strikeouts and fifty-eight walks in three hundred and eleven innings. In 1964 it fell to 1.74. In 1965 he struck out three hundred and eighty-two batters in three hundred and thirty-five and two-thirds innings and walked seventy-one. In 1966, his last season, his earned run average was 1.73, and he completed twenty-seven of the forty-one games he started.
The career total is two thousand three hundred and ninety-six strikeouts and eight hundred and seventeen walks across two thousand three hundred and twenty-four and one-third innings. His earned run average across all twelve seasons was 2.76. He won one hundred and sixty-five games and lost eighty-seven. He threw forty shutouts — games in which the opposing team never scored — and completed one hundred and thirty-seven games, meaning he pitched all nine innings without relief. The last game he played was on 2 October 1966.
Why it mattered then
A pitcher who cannot throw strikes is a liability, however hard he throws. A pitcher who walks more than half a batter per inning, as he did in 1958, gives runs away before the other team swings. The early years were a puzzle: the strikeouts suggested real ability, but the walks made him unusable in close games. Managers had to decide whether to wait for control that might never arrive, or to give up on a left-hander who could miss bats when he found the plate. The transformation between 1960 and 1961 changed what was possible. In 1961 he walked ninety-six batters in two hundred and fifty-five and two-thirds innings, which is still high but no longer disabling. By 1962 the walks had fallen to fifty-seven in one hundred and eighty-four and one-third innings, and the strikeouts were still climbing. A pitcher who can strike out more than two hundred batters in a season and walk fewer than sixty is a different kind of asset: he can start important games, finish them, and face any hitter in the lineup without conceding free runners. The last five seasons — 1962 through 1966 — are what made the career matter in its own moment. The earned run averages in those years were 2.54, 1.88, 1.74, 2.04, and 1.73. The strikeout totals were two hundred and sixteen, three hundred and six, two hundred and twenty-three, three hundred and eighty-two, and three hundred and seventeen. The complete game totals were eleven, twenty, fifteen, twenty-seven, and twenty-seven. Those are not the numbers of a pitcher learning his trade; they are the numbers of someone who had learned it.
Why it matters now
The career is a case study in what control means for a pitcher. Velocity and movement matter, but a pitch that does not cross the plate is worse than useless: it advances the runner without requiring a swing. The first half of the career demonstrates that talent without control is not enough. The second half demonstrates what happens when control arrives. The shape of the career also raises a question about durability. He pitched three hundred and eleven innings in 1963, three hundred and thirty-five and two-thirds in 1965, and three hundred and twenty-three in 1966. Those are not totals a modern pitcher would be asked to throw: the current understanding of arm health would limit him to far fewer innings per season. Whether he could have pitched longer under a different workload, or whether the workload itself shortened the career, is not a question the figures can answer. What is certain is that the career ended at age thirty, after twelve seasons, and that the last season was among the most productive. The walk totals in the later years — fifty-eight in 1963, fifty-three in 1964, seventy-one in 1965, seventy-seven in 1966 — are low enough that nearly every batter faced had to earn his way on base. The strikeout totals in those same years are high enough that many batters never put the ball in play at all. That combination — few free passes, many swings and misses — is the definition of control, and it is what the second half of the career delivered.
The surprising detail
The two totals that sit oddest together are the eight hundred and seventeen walks across the whole career and the fifty-three walks in 1964. The career total averages out to just over sixty-eight walks per season, but the 1964 figure is fifteen walks below that average, and it came in two hundred and twenty-three innings — more innings than he pitched in any season before 1961. The control that eluded him for the first six years arrived suddenly and stayed. In 1963 he walked fifty-eight batters in three hundred and eleven innings, which is one walk every five and a third innings. In 1965 he walked seventy-one in three hundred and thirty-five and two-thirds innings, which is one walk every four and three-quarter innings. Those are not the numbers of a pitcher still learning to throw strikes. They are the numbers of someone who has solved the problem entirely.
What is disputed
Every figure here comes from the MLB Stats API. Statistical categories were not all recorded consistently across the twelve seasons covered, and some figures — particularly for relief appearances and saves in the 1950s — were compiled retrospectively from contemporary scoring. The totals are the ones the league publishes today rather than anything independently recomputed here.
Remember this
Six years learning to throw strikes, six years throwing them better than almost anyone: the career is two halves, and the second half is what lasted.
Test yourself
The debut game linescore shows Brooklyn made nine hits to Milwaukee's eight, yet Milwaukee won 8–2. Using only the linescore, what explains the result?
Errors and timing. Brooklyn made two errors to Milwaukee's none, and the two-run gap in those mistakes is exactly the width of the final margin. The timing of the runs also matters: Milwaukee scored three runs in the second inning and three more in the third, building a 7–0 lead before Brooklyn scored at all. Equal hits do not mean equal innings — clustered hits score, scattered ones strand runners. Brooklyn's nine hits produced only two runs, which suggests those hits were spread across different innings rather than grouped together. Note too that Milwaukee never batted in the ninth, which is why that half-inning shows a dash: the home side does not bat when it is already ahead.
Go deeper
- Sandy Koufax — MLB Stats API player record · MLB Advanced Media
- Sandy Koufax — career pitching totals (MLB Stats API) · MLB Advanced Media
- Debut game linescore — MLB Stats API game 136961 · MLB Advanced Media
- Sandy Koufax — Wikidata · Wikidata
Image: publicity still, Public domain. Licence: Public domain. Source.